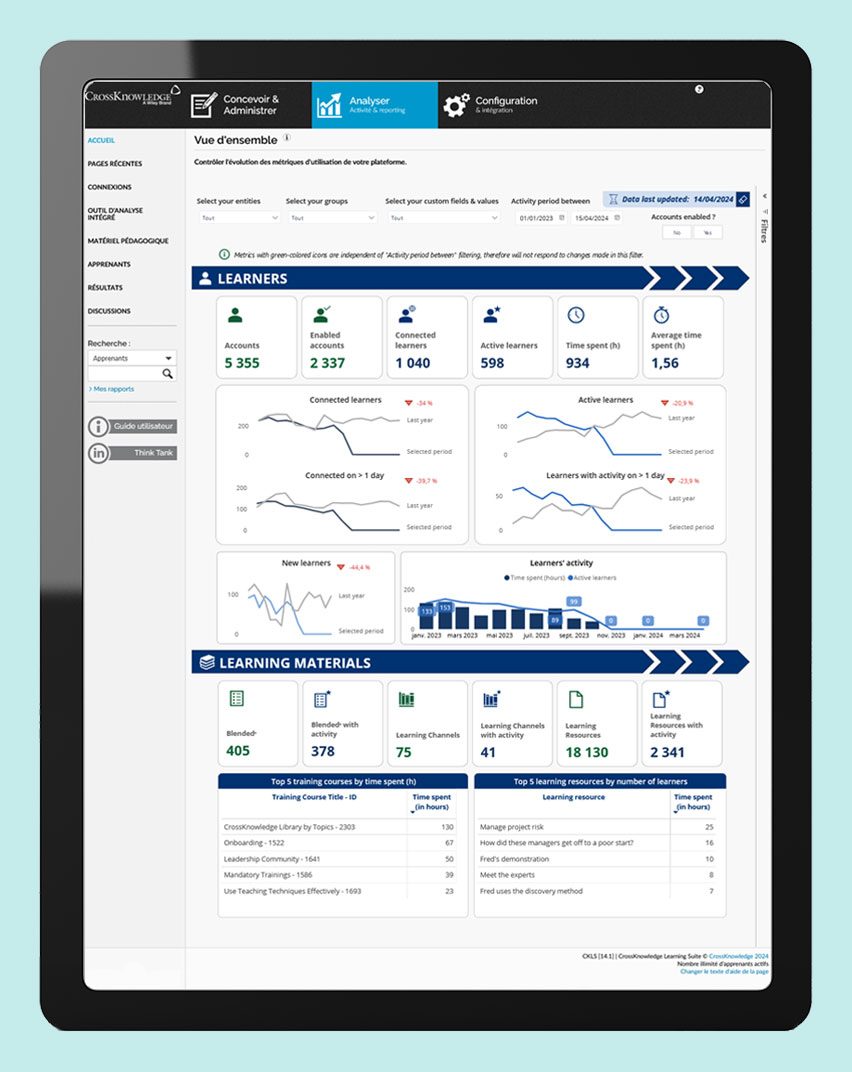
Ready-to-use visualizations to understand the big picture!
- A wide range of graphs and data points to understand learner activity and engagement, the attractiveness and awareness of your platform, and the performance of your programs
- Key descriptive data at a glance, from aggregated to more granular, with advanced filtering capabilities
- Make better-informed decisions to adjust and improve your learning experience and strategy

Detailed reports for deeper analysis

- Dig deeper into any of the visualizations by exporting granular data to understand the underlying causes of the patterns you see
- Access over 30 additional reports to analyze your initiatives with more specific KPIs
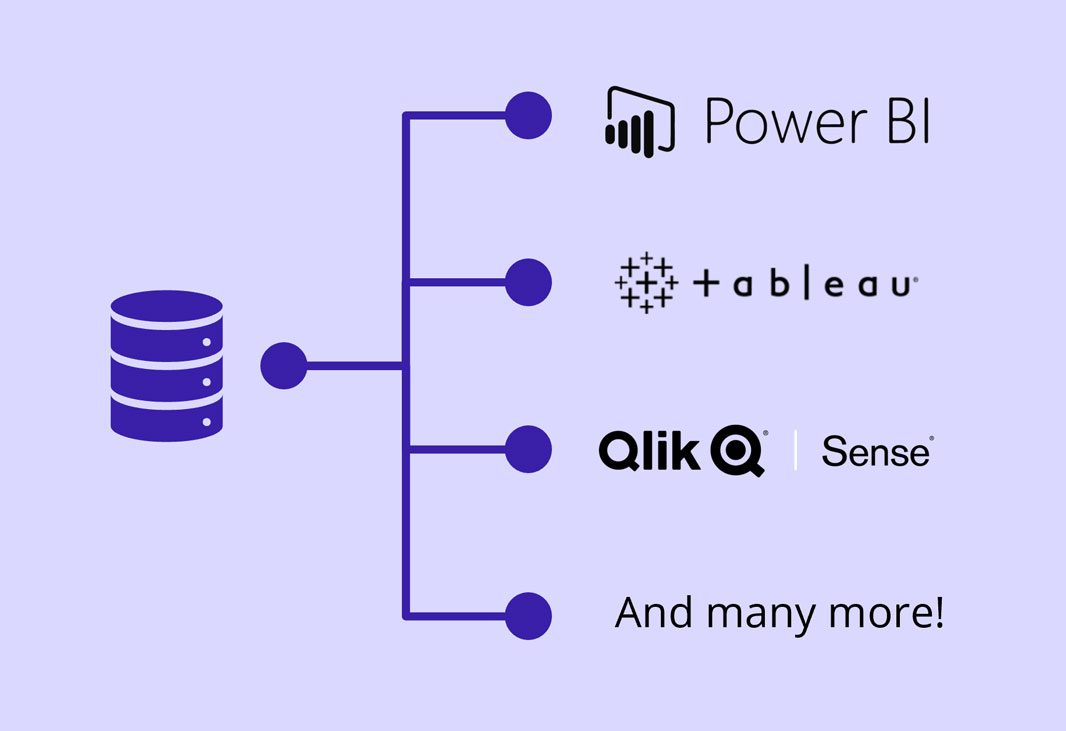
Full control for advanced analytics
- Raw data extracts automated straight from our data lake
- Covering a broad set of data points
- Delivered to you on a regular schedule
- Build your own dashboards in addition to CrossKnowledge dashboards and back-office reporting
The Training Dashboard: A Powerful Tool for L&D
Data is now at the heart of everything we do.